J Korean Neurol Assoc > Volume 40(2); 2022 > Article
응급실에서 임상 진료과의 진료부담과 신경과 의사의 업무과다

Abstract

Background

To evaluate workload in emergency rooms (ERs) among clinical specialties including neurology and investigate characteristics of neurological consultations in ER.

Methods

A nationwide survey was conducted to evaluate the number of specialists, resident physicians/surgeons, and emergency consultations of each clinical specialty in Korean tertiary referral hospitals from 2018 to 2019. Characteristics of neurological emergency consultations during the same period were investigated in one of the hospitals that participated.

Results

A total of 23 hospitals were included. Four irrelevant clinical specialties were excluded. The number of neurology specialists and resident physicians were 12.5/hospital (4.1% of all specialists) and 6.4/hospital (3.4% of all resident physicians/surgeons), respectively, while the mean numbers of specialists and resident physicians or surgeons per clinical specialty were 13.7/hospital and 8.6/hospital, respectively. Neurological consultations accounted for 11.0% of all ER consultations for severe patients (Korean Triage and Acuity Scale level 1-3). Annual ER consultations for severe patients per neurology specialist was 274.1, which was only second to pediatrics (290.0). Annual ER consultations for severe patients per resident physician was 406.6 which was 1.6 times higher than the second highest (internal medicine, 247.0). Frequent conditions for neurological ER consultation were dizziness (24.8%), motor weakness (23.9%), headache (10.6%), dysarthria (9.9%), and seizures (7.7%). Frequent primary diagnoses were cerebrovascular diseases (29.0%) and episodic and paroxysmal disorders (24.9%).

Conclusions

Workloads of neurology specialists for ER consultation were significantly heavy, and the workload of neurology resident physicians was the heaviest among all specialties. This should be considered in health care policies.

서 론

응급 환자에 대한 진료는 의료에 있어 가장 필수적이고도 중요한 영역이다. 뇌혈관질환이나 뇌전증발작과 같은 신경계질환은 응급실 내원의 주된 사유 중 하나로 빠른 진단과 정확한 치료가 추후 환자의 예후에 있어 매우 중요하다. 게다가 인구의 노령화에 따라 응급실에서도 노인 환자의 진료가 늘어나고 있는데, 노인에서는 신경계 응급상황이 더욱 흔하고 내과 문제에 의한 증상과 신경계 문제에 의한 증상을 구분하기 어려운 경우가 많다[1]. 이에 따라 응급 환자에 대한 신경과 의사의 역할은 나날이 중요해지고 있다[2,3]. 그러나 대한민국에서 신경과 전문의 육성을 위한 전공의 과정의 정원은 2011년 104명에서 2021년 89명으로 오히려 감소하여 응급 신경계질환의 진료에 있어 공백이 우려된다[4,5]. 향후 의료진 수급의 예측에 있어 응급 진료의 수요는 필수적으로 고려되어야 한다. 그러나 각 전문진료과별 응급실 진료 규모에 대한 자료는 부족하다.
본 연구는 대한민국의 의료법 및 하위 법령에 따라 각 진료권역별 소요병상수를 고려하여 중증질환에 대하여 난이도가 높은 의료행위를 전문적으로 하는 종합병원으로 지정된 상급종합병원에서 각 전문진료과별 응급실 진료 분담률을 조사하여 신경과 의사의 상대적인 응급실 진료 부담을 평가하고, 또한 신경과 의사가 진료하는 응급 환자의 특성을 조사할 목적으로 시행되었다.

대상과 방법

대한민국에서 보건복지부장관에 의해 2018년부터 2020년까지 상급종합병원으로 지정된 42개 기관 중 신경과 수련병원으로 지정되지 않은 1개 기관을 제외한 41개 기관을 대상으로 2018년 1월 1일부터 2019년 12월 31일까지 2년의 기간 중 각 전문진료과의 의료진과 응급실 진료 상황에 대한 자료를 조사하였다. 조사는 각 상급종합병원에 서면을 통해 자료를 요청하고, 회신한 자료를 취합하는 방식으로 이루어졌다.
의료진 상황에 대한 정보로는 연도별 각 전문진료과별 전임 전문의 수, 비전임 전문의 수, 전공의 수를 조사하였다. 전임 전문의는 병원에 전속되어 있으며, 통상 불특정 장기간 근무할 것으로 예상되는 직급(진료교수, 임상교수, 겸직교수, 향후 장기적 운영 계획으로 채용된 입원/응급실 전담전문의 등)으로 근무하는 전문의로 정의하였다. 비전임 전문의는 병원에 전속되어 있으며, 통상 특정 기간 동안의 수련이나 특수 목적으로 단기간 근무할 것으로 예상되는 직급(전임의, 임상강사, 촉탁의, 일시적인 사정에 의하여 단기적 운영 계획으로 채용된 입원/응급실 전담전문의 등)으로 근무하는 전문의로 정의하였다. 전공의 수는 실제 근무하는 인원 수가 아닌, 결원을 감안하지 않은 해당 기간 각 연차의 정원의 합으로 하였다.
응급실 진료 상황에 대한 정보로는 연도별로 각 전문진료과별 응급실 진료 건수를 중증도에 따라 구분하여 조사하였다. 응급진료의 중증도는 2012년에 개발되어 2016년 1월부터 전국의 권역 및 전문, 지역 응급의료센터에서 사용되고 있는 한국형 응급 환자 분류도구(Korean Triage and Acuity Scale, KTAS)를 이용하였다[6]. KTAS는 환자를 응급도에 따라 5단계(1, 소생[resuscitation]; 2, 긴급[emergent]; 3, 응급[urgent]; 4, 준응급[less urgent]; 5, 비응급[non urgent])의 등급으로 분류한다[7]. 본 연구에서는 응급의료에 관한 법률 시행규칙 제18조의3에 의거 중증 응급 환자(KTAS 1 및 2단계)와 중증 응급의심 환자(KTAS 3단계)를 중증 환자로, 경증 응급 환자(KTAS 4단계)와 비응급 환자(KTAS 5단계)를 경증 환자로 정의하였다[8].
추가로, 임의 선정된 1개의 상급종합병원을 대상으로 응급실에서 신경과 의사가 진료한 환자들의 연령, 성별 등의 인구학 특성과 주호소, 주진단, 응급 진료 결과 등의 임상 특성을 조사하였다.

결 과

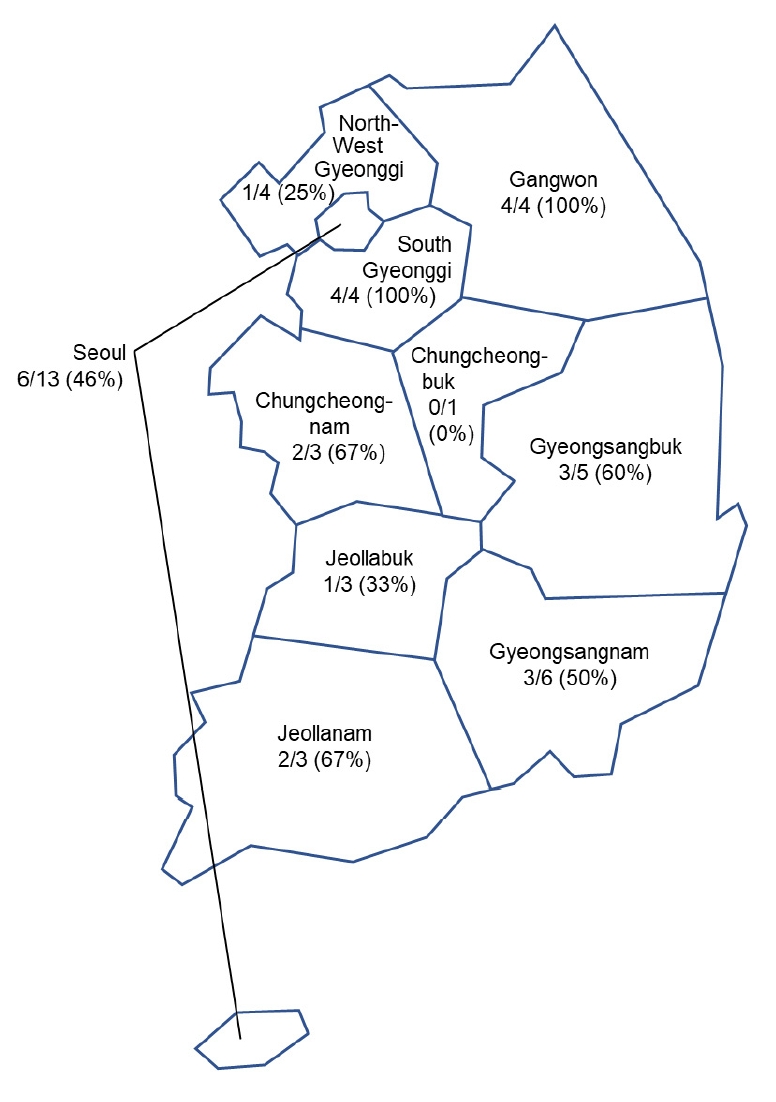
자료를 요청한 41개 상급종합병원 중 32개 기관에서 자료를 회신하였고, 이 중 불완전한 자료를 회신한 9개 기관을 제외한 23개(56%) 상급종합병원이 분석에 포함되었다(Fig. 1). 대한민국의 10개 진료권역 중 1개 진료권역(충북권)을 제외한 모든 진료권역의 상급종합병원이 포함되었다. 의료법 시행규칙에 따른 26개 전문진료과 중 응급실 진료를 전담하는 응급의학과와, 조사 결과 응급실 진료 실적이 없는 결핵과 및 예방의학과, 직업환경의학과는 분석에 포함하지 않았다.

1. 전문진료과별 의사 수

2018년과 2019년 두 해 동안 23개 상급종합병원의 전체 전문의 수는 전문진료과별 평균 316.0명(병원당 13.7명; 전임 전문의 239.2명[병원당 10.4명], 비전임 전문의 76.8명[병원당 3.3명]), 전공의 수는 전문진료과별 평균 198.0명(병원당 8.6명)이었다(Table 1). 신경과 전체 전문의 수는 288.5명(병원당 12.5명; 전임 전문의 219.5명[병원당 9.5명], 비전임 전문의 69.0명[병원당 3.0명]), 전공의 수는 148.0명(병원당 6.4명)이었다. 신경과의 전임 전문의 규모는 22개 전문진료과목 중 7위이고 전체 전임 전문의의 4.2%를 차지하였으며, 비전임 전문의 규모는 8위(4.1%), 전공의 규모는 13위(3.4%)였다.

2. 전문진료과별 응급실 진료 건수

2018년과 2019년 두 해 동안 22개 전문진료과 전체의 연간 응급실 진료 건수는 829,769.0건이었고 이 중 중증 진료건수는 544,886.0건(65.6%)이었다(Table 2). 전문진료과별 평균 응급실 진료 건수는 37,716.7건이었다. 신경과의 연간 응급실 진료 건수는 68,221.0건으로 전체 응급실 진료의 8.2%를 차지하였고 진료 건수 규모는 22개 전문진료과 중 3위였다. 신경과의 연간 응급실 진료 건수 중 중증 진료는 60.169.5건으로 전체 중증 진료 건수의 11.0%를 차지하였고 진료 건수 규모는 22개 전문진료과 중 3위였다.

3. 전문진료과별 의사당 응급실 진료 건수

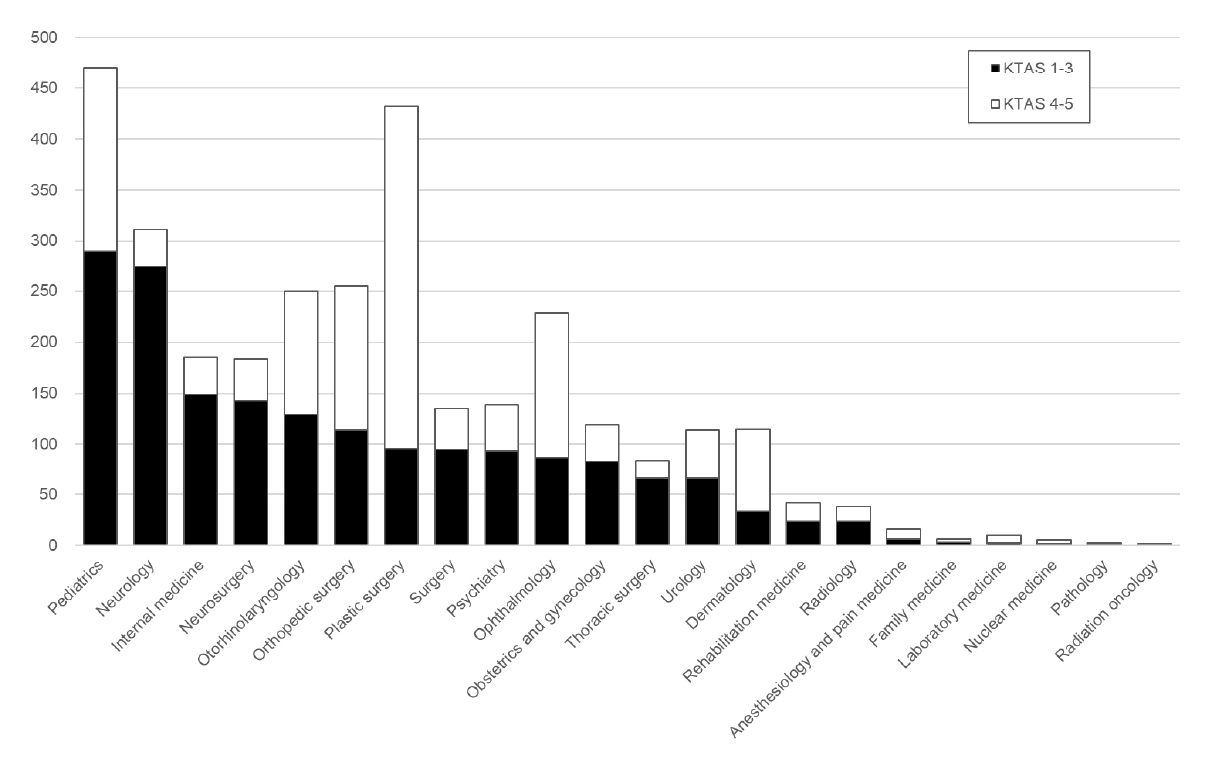
전임전문의 1인당 연간 응급실 진료 건수는 중증과 비중증 환자를 모두 포함할 때 평균 143.0건, 중증 환자의 경우 평균 81.0건이었으며, 비전임 전문의를 포함한 전체 전문의 1인당 연간 응급실 진료 건수는 중증과 비중증을 포함하여 평균 106.3건, 중증 환자의 경우 평균 60.6건이었다(Table 3). 각 전문진료과별로 보면 전임전문의 1인당 응급실 중증 진료 건수는 소아청소년과가 290.0건으로 가장 많았고, 신경과는 274.1건으로 두 번째로 많았다. 비전임 전문의를 포함한 전체 전문의 1인당 응급실 중증 진료 건수도 소아청소년과가 215.3건으로 가장 많았으며 신경과가 208.6건으로 그 뒤를 이었다(Fig. 2).
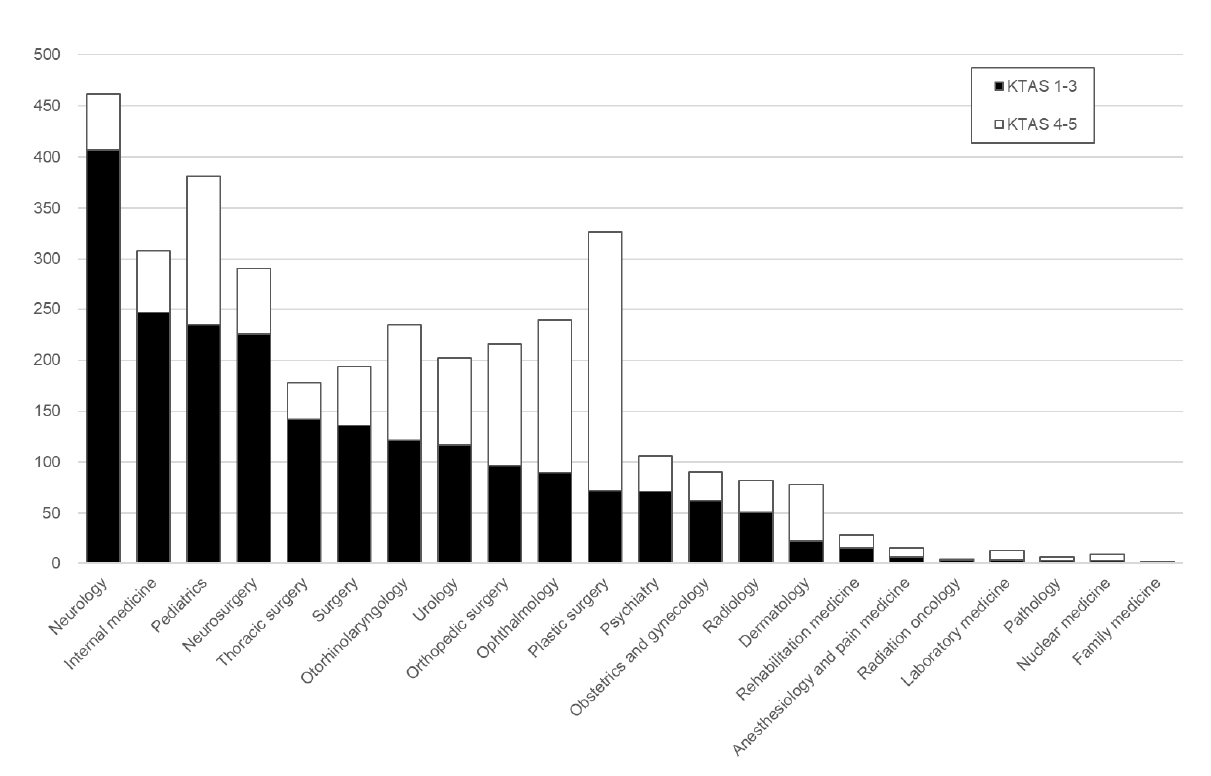
실제 응급실 진료에서 주된 역할을 담당하는 전공의의 1인당 연간 응급실 진료 건수는 중증과 비중증 포함 평균 157.7건, 중증은 평균 97.0건이었다. 각 전문진료과 중 신경과 전공의의 1인당 연간 응급실 중증 진료 건수는 406.6건으로 가장 많았으며, 소아청소년과의 전공의 1인당 연간 응급실 중증 진료 건수는 234.9건으로 두 번째로 많았다(Fig. 3).

4. 신경과의 응급실 진료 특성

단일 상급종합병원에서 2018년 1월 1일부터 2019년 12월 31일까지 2년간 신경과의 응급실 진료 건수는 7,025건이었다. 이 중 여성이 3,605명(51.3%)이었으며 연령은 64.7±16.5세(범위: 14-104세)였다. 신경과가 응급실에서 진료한 흔한 임상 문제는 어지러움(1,743건, 24.8%), 운동위약(1,682건, 23.9%), 두통(748건, 10.6%), 구음장애(693건, 9.9%), 발작이나 일시적 의식 소실(538건, 7.7%) 순이었다(Table 4).
신경과 응급실 진료의 주진단 질병군은 신경계통의 질환(G00-G99)이 2,254건(32.1%)으로 가장 많았고, 순환계통의 질환(I00-I99)이 2,130건(30.3%)이었다. 신경계통의 질환 중 가장 많은 질병군은 뇌전증발작과 두통장애, 일과성허혈발작 등을 포함하는 우발 및 발작장애(G40-G47)이 1,747건(24.9%)으로 가장 흔하였고, 순환계통의 질환에서는 뇌경색 등을 포함하는 뇌혈관질환(I60-I69)이 2,036건(29.0%)으로 가장 흔하였다.
신경과 응급실 진료 건수 중 3,728건(53.1%)에서는 진료를 받은 환자가 입원하였고, 3,258건(46.4%)에서는 환자가 퇴실 및 귀가 조치되었다. 주증상별로 보면 운동위약(77.2%), 구음장애(68.8%), 인지/행동이상(66.6%), 시각상(63.6%), 의식장애(62.2%) 등의 순으로 높은 입원율을 보였다(Table 4). 주진단별로는 뇌혈관질환이 속한 순환계통의 질환의 입원율이 90.3%로 가장 높았다(Table 5).

고 찰

본 연구는 대한민국 상급종합병원에서 신경과를 포함한 각 전문 진료과별 의사 수와 응급실 진료 건수를 조사함으로써 각 진료과별 응급실 진료 부담을 조사하고자 하였다. 23개 상급종합병원의 신경과 의사 수는 응급의학과 외에 응급실 진료에 참여한 22개 전문진료과 전체 의사 중 전문의의 4.1%, 전공의의 3.4%에 불과하였으나 KTAS 1-3점의 중증 환자의 응급실 진료의 11.0%를 담당하고 있었다. 전임 전문의 1인당 응급실 중증 환자 진료 건수는 소아청소년과(290.0건)와 신경과(274.1건)와 다른 전문진료과에 비해 두드러지게 많았고(Fig. 2), 전공의 1인당 응급실 중증 환자 진료 건수는 신경과가 406.6건으로 다른 모든 전문진료과에 비해 두드러지게 많았다(Fig. 3).
본 연구에서 신경과 의사는 응급의학과를 제외한 전문진료과의 응급실 진료의 8.2%, 중증 환자에 대한 응급실 진료의 11.0%를 담당하고 있었고, 이는 내과 다음으로 높은 응급 진료 부담률이었다. Youn 등[9]이 1992년 1년간 대한민국의 단일 상급종합병원 성인 응급실에서 이루어진 진료에 대하여 후향적으로 조사한 바 있는데, 이에 따르면 신경과는 응급실 진료 환자의 6.2%를 담당하였고, 44.8%를 담당한 내과 다음으로 두 번째로 많은 비율이었다. 다른 나라들의 경우, Moulin 등[10]의 연구에 따르면 1997년 1월부터 12월까지 1년간 프랑스의 단일 대학병원 응급실에 전체 환자 11,421명 중 1,679명(14.7%)이 신경과 의사의 진료를 받았다. 또한, 스페인의 단일 3차병원에서 시행된 연구에서는 1년의 기간 동안 응급실에 내원한 전체 환자 중 8.75%가, 또 다른 스페인의 단일 대학병에서는 7.8%, 이탈리아의 단일 병원 응급실에 내원한 전체 환자 중 5%가 신경과 의사의 진료를 받아, 본 연구와 유사한 비율을 보고하였다[11-13].
신경과 의사가 응급 진료를 한 주된 증후는 어지러움, 두통, 발작 그리고 운동위약이나 구음장애 같은 국소신경학적 결손이었다. 비록 이 결과가 본 연구에 포함된 상급종합병원 중 단일기관에서만 수집된 자료이기는 하나, 다른 나라의 단일기관 기반 연구에서도 유사한 결과를 보였다[10,12,14-16]. 2004년 3월부터 7월까지 5개월간 터키의 단일 신경계 응급실 내원 환자를 분석한 결과, 가장 흔한 증상은 두통(30.8%)이었으며 진단은 두통(27.8%), 뇌졸중(20.6%), 말초현기증(13%) 순으로 흔했으며[16], Moulin 등[10]의 프랑스 단일 대학병원 응급실에서의 연구를 보면 신경과 의사의 진료를 받은 환자의 임상 원인의 빈도는 뇌졸중(33.1%), 뇌전증(20%), 의식소실(9%), 두통(9%), 혼돈(5,4%) 등의 순서였다. de Falco 등[14]이 이탈리아 전역의 159개 병원을 대상으로 조사한 결과 전체 신경과 진료의 57%가 응급실에서 이루어졌는데, 응급 진료의 주된 원인은 뇌혈관질환(28%), 두통(22%), 어지러움(13%), 머리 외상(13%), 의식장애(12%), 뇌전증(9%) 순이었다. 다른 단일 응급실 연구들에서도 뇌혈관질환이 신경과 의사의 응급 진료의 가장 흔한 진단이었고, 그 외 두통질환과 뇌전증발작, 의식장애, 어지러움 등이 흔한 진단이었다[12,13,15]. 본 연구에서도 가장 흔한 주 진단군은 29.0%를 차지한 뇌혈관질환(I60-69)이었고, 두 번째로 흔한 주 진단군은 뇌전증과 두통, 일과성허혈발작 등이 포함되는 우발 및 발작장애(G40-G47)로 24.9%를 차지하였다.
뇌혈관질환과 뇌전증발작 등은 빠른 진단과 치료가 필수적인 질환이다. 특히 급성뇌경색에 대한 혈전용해 치료 및 혈관내재개통 치료의 발달로 인해 상당한 장애를 안고 살아갈 수밖에 없었던 환자들이 정상에 가까운 수준으로 회복될 수 있는 기회를 제공해주고 있다. 그러나 이러한 회복을 위해서는 분초를 다투는 빠른 진단과 치료가 필수적이다[17,18]. 뇌전증지속상태는 사망률이 20%에 달하는 질환으로, 빠른 진단과 치료가 환자의 생존 및 예후에 가장 큰 영향을 미치는 인자 중 하나이다[19]. 신경계 응급상황에 대한 적절한 진단과 치료를 위해서는 신경과 의사의 역할이 필수적이다. 응급실 의사가 진료한 환자를 신경과 의사가 다시 진료한 경우의 52.5%에서 진단과 치료가 완전히 바뀌었고, 35.1%에서는 진단은 바뀌지는 않았으나 추가적인 처치가 시행되었다는 연구 결과는 응급실 환자에 대한 신경과 의사의 역할의 중요성을 시사한다[10].
본 연구에서 가장 두드러지는 점은 신경과 전공의의 응급실 진료 부담이 다른 전문진료과들에 비해 상당한 차이로 높다는 점이다. 특히 전공의 1인당 KTAS 1-3점의 중증 응급 환자 진료 건수(406.6건)는 두 번째로 높은 내과(247.0건)와 비교해도 1.6배이며, 전체 전문진료과 평균(97.0건)과 비교할 때 4.2배에 달한다. 전공의가 응급실 진료에서 주된 역할을 담당하고 있는 현실과 신경계 응급이 빠른 의사결정과 치료를 요한다는 점을 고려할 때 이는 매우 우려스럽다. 노령화로 신경계 응급질환이 증가하고 있는 상황에서 적절한 신경과적 진단과 치료를 위해서는 신경과 의사의 인력 보충이 필수적이라 사료된다.
본 연구의 전문진료과별 응급진료 부담에 대한 결과는 충북권을 제외한 모든 진료권역에서 1개 이상의 상급종합병원이 분석에 포함되었으며, 2년의 기간 동안 이루어진 모든 응급 진료가 포함되었다는 점에서 표본의 대표성이 비교적 높다는 강점이 있다. 이 결과는 향후 신경과 전공의 수련과정의 보완을 위한 자료뿐만 아니라 전체 보건의료정책에 있어 중요한 자료로 활용될 수 있을 것이다.

REFERENCES

1. Lee SB, Oh JH, Park JH, Choi SP, Wee JH. Differences in youngest-old, middle-old, and oldest-old patients who visit the emergency department. Clin Exp Emerg Med 2018;5:249-255.
crossref pmid pmc
2. Stone K. When seconds count: tackling neurological emergencies. Lancet Neurol 2009;8:702-703.
crossref pmid
3. Micieli G, De Falco FA, Consoli D, Inzitari D, Sterzi R, Tedeschi G, et al. The role of emergency neurology in Italy: outcome of a consensus meeting for a intersociety position. Neurol Sci 2012;33:297-304.
crossref pmid
4. Yang GD. "Patient care is at risk" claimed neurology professors. [online] 2017 Oct 16 [cited 2021 Oct 6]. Available from: URL: http://www.docdocdoc.co.kr/news/articleView.html?idxno=1047680.

5. Lim WJ. Though number of stroke patients is rising, training hospitals are failing to recruit neurology residents and are in crisis. [online] 2018 Jan 15 [cited 2021 Oct 6]. Available from: URL: https://www.sedaily.com/NewsVIew/1RUFS27N2H.

6. Lee KH, Cho SJ, Lee JE, Lim TH, Park IC, Lee JH, et al. Study for standardization of severity classification system for emergency patients. Seoul: Ministry of Health and Wellfare, 2012.

7. Lee I, Kim O, Kim C, Oh J, Lim T, Lee J, et al. Validity analysis of Korean triage and acuity scale. J Korean Soc Emerg Med 2018;29:13-20.

8. Manack A, Turkel C, Silberstein S. The evolution of chronic migraine: classification and nomenclature. Headache 2009;49:1206-1213.
crossref pmid
9. Youn YK, Jeong YK, Yun HY. Analysis of emergency patients who visited tertiary medical center. J Korean Soc Traumatol 1994;7:92-98.

10. Moulin T, Sablot D, Vidry E, Belahsen F, Berger E, Lemounaud P, et al. Impact of emergency room neurologists on patient management and outcome. Eur Neurol 2003;50:207-214.
crossref pmid
11. Rudolf J, Dermitzakis EV, Kyriazopoulou E, Nikiforidou D, Gravas I, Papadopoulos V, et al. Workload of the emergency room neurologists and the neurological inpatient department in a Greek tertiary care hospital. Clin Neurol Neurosurg 2010;112:332-335.
crossref pmid
12. García-Ramos R, Moreno T, Camacho A, González V, Bermejo F. Neurological emergencies in a university hospital. Neurologia 2003;18:431-438.
pmid
13. Delodovici M, Mauri M, Meneri M, Gallazzi M, Ballabio E, Borutti G, et al. The neurologist in the emergency room: prospective study of the neurological emergency group in Lombardia. J Health Sci (El Monte) 2019;7:254-261.

14. de Falco FA, Sterzi R, Toso V, Consoli D, Guidetti D, Provinciali L, et al. The neurologist in the emergency department. An Italian nationwide epidemiological survey. Neurol Sci 2008;29:67-75.
crossref pmid
15. Rizos T, Jüttler E, Sykora M, Poli S, Ringleb PA. Common disorders in the neurological emergency room--experience at a tertiary care hospital. Eur J Neurol 2011;18:430-435.
crossref pmid
16. Coban E, Mutluay B, Sen A, Keskek A, Atakl D, Soysal A. Characteristics, diagnosis and outcome of patients referred to a specialized neurology emergency clinic: prospective observational study. Ann Saudi Med 2016;36:51-56.
crossref pmid pmc
17. Hacke W, Kaste M, Bluhmki E, Brozman M, Dávalos A, Guidetti D, et al. Thrombolysis with alteplase 3 to 4.5 hours after acute ischemic stroke. N Engl J Med 2008;359:1317-1329.
crossref pmid
18. Berkhemer OA, Fransen PS, Beumer D, van den Berg LA, Lingsma HF, Yoo AJ, et al. A randomized trial of intraarterial treatment for acute ischemic stroke. N Engl J Med 2015;372:11-20.
pmid
19. Alkhachroum A, Der-Nigoghossian CA, Rubinos C, Claassen J. Markers in status epilepticus prognosis. J Clin Neurophysiol 2020;37:422-428.
crossref pmid pmc

Figure 1.
Tertiary referral hospitals of 10 Korean health service areas included in the study. Numerator indicates the number of tertiary referral hospitals included in the study and denominator indicates all tertiary referral hospitals in each Korean health service area. By the Ordinance of the Ministry of Health and Welfare, Jeju island is included in the Seoul area.
jkna-40-2-127f1.jpg
Figure 2.
Annual emergency room consultations per specialists with permanent position by clinical specialties. KTAS; Korean Triage and Acuity Scale.
jkna-40-2-127f2.jpg
Figure 3.
Annual emergency room consultations per resident physician/surgeon by clinical specialties. KTAS; Korean Triage and Acuity Scale.
jkna-40-2-127f3.jpg
Table 1.
Number of specialists and resident physicians/surgeons of each clinical speciality in all 23 tertiary referral hospitals
Year 2018
Year 2019
Annual average
Specialists in permanent position Specialists in temporary position Specialists in all position Resident physicians/surgeons Specialists in permanent position Specialists in temporary position Specialists in all position Resident physicians/surgeons Specialists in permanent position Specialists in temporary position Specialists in all position Resident physicians/surgeons
All specialties 5,193 1,673 6,866 4,358 5,332 1,707 7,039 4,353 5,262.5 (100.0) 1,690 (100.0) 6,952.5 (100.0) 4,355.5 (100.0)
Internal medicine 1,283 469 1,752 775 1,315 449 1,764 790 1,299.0 (24.7) 459.0 (27.2) 1,758 (25.3) 782.5 (18.0)
Radiology 453 126 579 212 467 119 586 214 460.0 (8.7) 122.5 (7.2) 582.5 (8.4) 213.0 (4.9)
Surgery 437 153 590 298 454 162 616 325 445.5 (8.5) 157.5 (9.3) 603.0 (8.7) 311.5 (7.2)
Anesthesiology and pain medicine 321 73 394 323 318 87 405 323 319.5 (6.1) 80.0 (4.7) 399.5 (5.7) 323.0 (7.4)
Pediatrics 257 86 343 337 276 99 375 321 266.5 (5.1) 92.5 (5.5) 359.0 (5.2) 329.0 (7.6)
Orthopedic surgery 235 125 360 285 244 131 375 281 239.5 (4.6) 128.0 (7.6) 367.5 (5.3) 283.0 (6.5)
Neurology 213 67 280 147 226 71 297 149 219.5 (4.2) 69.0 (4.1) 288.5 (4.1) 148.0 (3.4)
Neurosurgery 209 59 268 137 213 57 270 130 211.0 (4.0) 58.0 (3.4) 269.0 (3.9) 133.5 (3.1)
Pathology 180 29 209 87 182 28 210 84 181.0 (3.4) 28.5 (1.7) 209.5 (3.0) 85.5 (2.0)
Obstetrics and gynecology 173 60 233 223 172 74 246 234 172.5 (3.3) 67.0 (4.0) 239.5 (3.4) 228.5 (5.2)
Otorhindaryngology 169 50 219 186 174 47 221 179 171.5 (3.3) 48.5 (2.9) 220.0 (3.2) 182.5 (4.2)
Thoracic surgery 171 40 211 77 171 43 214 83 171.0 (3.2) 41.5 (2.5) 212.5 (3.1) 80.0 (1.8)
Ophthalmology 160 90 250 159 172 93 265 158 166.0 (3.2) 91.5 (5.4) 257.5 (3.7) 158.5 (3.6)
Psychiatry 147 48 195 197 153 49 202 196 150.0 (2.9) 48.5 (2.9) 198.5 (2.9) 196.5 (4.5)
Urology 146 33 179 84 143 33 176 79 144.5 (2.7) 33.0 (2.0) 177.5 (2.6) 81.5 (1.9)
Laboratory medicine 121 30 151 93 119 26 145 87 120.0 (2.3) 28.0 (1.7) 148.0 (2.1) 90.0 (2.1)
Rehabilitation medicine 102 24 126 154 114 27 141 156 108.0 (2.1) 25.5 (1.5) 133.5 (1.9) 155.0 (3.6)
Plastic surgery 97 33 130 130 99 34 133 129 98.0 (1.9) 33.5 (2.0) 131.5 (1.9) 129.5 (3.0)
Radiation oncology 93 19 112 37 92 13 105 35 92.5 (1.8) 16.0 (0.9) 108.5 (1.6) 36.0 (0.8)
Dermatology 85 20 105 121 82 20 102 123 83.5 (1.6) 20.0 (1.2) 103.5 (1.5) 122.0 (2.8)
Family medicine 78 26 104 252 79 32 111 247 78.5 (1.5) 29.0 (1.7) 107.5 (1.5) 249.5 (5.7)
Nuclear medicine 63 13 76 44 67 13 80 30 65.0 (1.2) 13.0 (0.8) 78.0 (1.1) 37.0 (0.8)
Mean 236.0 76.0 312.1 198.1 242.4 77.6 320.0 197.9 239.2 (4.5) 76.8 (4.5) 316.0 (4.5) 198.0 (4.5)

Values are presented as number (%). Clinical specialties were sorted by annual average number of specialists in permanent position.

Table 2.
Number of emergency room consultations of each clinical specialties in all 23 tertiary referral hospitals
Year 2018
Year 2019
Annual average
All KTAS 1-3 All KTAS 1-3 All KTAS 1-3
All specialties 815,369.0 529,696.0 844,169.0 560,076.0 829,769.0 (100.0) 544,886.0 (100.0)
Internal medicine 241,682 192,052 240,208 194,530 240,945.0 (29.0) 193,291.0 (35.5)
Pediatrics 125,943 78,293 124,925 76,272 125,434.0 (15.1) 77,282.5 (14.2)
Neurology 67,098 58,960 69,344 61,379 68,221.0 (8.2) 60,169.5 (11.0)
Orthopedic surgery 61,369 26,987 60,814 27,763 61,091.5 (7.4) 27,375.0 (5.0)
Surgery 46,543 33,880 74,075 51,046 60,309.0 (7.3) 42,463.0 (7.8)
Otorhinolaryngology 43,619 22,542 42,135 21,814 42,877.0 (5.2) 22,178.0 (4.1)
Plastic surgery 42,232 9,310 42,317 9,450 42,274.5 (5.1) 9,380.0 (1.7)
Neurosurgery 39,138 29,586 38,315 30,630 38,726.5 (4.7) 30,108.0 (5.5)
Ophthalmology 36,436 11,609 39,475 16,948 37,955.5 (4.6) 14,278.5 (2.6)
Psychiatry 15,434 10,038 26,281 17,951 20,857.5 (2.5) 13,994.5 (2.6)
Obstetrics and gynecology 20,192 13,282 21,079 15,094 20,635.5 (2.5) 14,188.0 (2.6)
Radiology 26,720 16,194 8,432 5,416 17,576.0 (2.1) 10,805.0 (2)
Urology 16,242 9,291 16,697 9,813 16,469.5 (2.0) 9,552.0 (1.8)
Thoracic surgery 14,034 11,220 14,445 11,462 14,239.5 (1.7) 11,341.0 (2.1)
Dermatology 9,862 2,594 9,306 3,008 9,584.0 (1.2) 2,801.0 (0.5)
Anesthesiology and pain medicine 5,119 1,944 5,367 2,297 5,243.0 (0.6) 2,120.5 (0.4)
Rehabilitation medicine 2,302 1,185 6,823 3,901 4,562.5 (0.5) 2,543.0 (0.5)
Laboratory medicine 56 43 2,392 538 1,224.0 (0.1) 290.5 (0.1)
Pathology 1,025 484 1 1 513.0 (0.1) 242.5 (0.0)
Family medicine 169 94 851 442 510.0 (0.1) 268.0 (0.0)
Nuclear medicine 4 3 734 193 369.0 (0.0) 98.0 (0.0)
Radiation oncology 150 105 153 128 151.5 (0.0) 116.5 (0.0)
Mean 37,062.2 24,077.1 38,371.3 25,458.0 37,716.7 (4.5) 24,767.5 (4.5)

Values are presented as number (%). Clinical specialties were sorted by annual average number of all emergency room consultations.

KTAS; Korean Triage and Acuity Scale.

Table 3.
Number of emergency room consultations per specialist and resident physicians/surgeons of each clinical specialties
Specialists in permanent position
Specialists in all position
Resident physicians/surgeons
All KTAS 1-3 All KTAS 1-3 All KTAS 1-3
Pediatrics 470.7 290.0 349.4 215.3 381.3 234.9
Neurology 310.8 274.1 236.5 208.6 461.0 406.6
Internal medicine 185.5 148.8 137.1 109.9 307.9 247.0
Neurosurgery 183.5 142.7 144.0 111.9 290.1 225.5
Otorhinolaryngology 250.0 129.3 194.9 100.8 234.9 121.5
Orthopedic surgery 255.1 114.3 166.2 74.5 215.9 96.7
Plastic surgery 431.4 95.7 321.5 71.3 326.4 72.4
Surgery 135.4 95.3 100.0 70.4 193.6 136.3
Psychiatry 139.1 93.3 105.1 70.5 106.1 71.2
Ophthalmology 228.6 86.0 147.4 55.5 239.5 90.1
Obstetrics and gynecology 119.6 82.2 86.2 59.2 90.3 62.1
Thoracic surgery 83.3 66.3 67.0 53.4 178.0 141.8
Urology 114.0 66.1 92.8 53.8 202.1 117.2
Dermatology 114.8 33.5 92.6 27.1 78.6 23.0
Rehabilitation medicine 42.2 23.5 34.2 19.0 29.4 16.4
Radiology 38.2 23.5 30.2 18.5 82.5 50.7
Anesthesiology and pain medicine 16.4 6.6 13.1 5.3 16.2 6.6
Family medicine 6.5 3.4 4.7 2.5 2.0 1.1
Laboratory medicine 10.2 2.4 8.3 2.0 13.6 3.2
Nuclear medicine 5.7 1.5 4.7 1.3 10.0 2.6
Pathology 2.8 1.3 2.4 1.2 6.0 2.8
Radiation oncology 1.6 1.3 1.4 1.1 4.2 3.2
Mean 143.0 81.0 106.3 60.6 157.7 97.0

Clinical specialties were sorted by the number of emergency room consultations for severe (KTAS 1-3) patients per specialist in permanent position.

KTAS; Korean Triage and Acuity Scale.

Table 4.
Clinical problems requiring neurological consultation in emergency room
Patients Number and rate of admission Number and rate of discharge
Dizziness 1,743 (24.8) 630 (36.1) 1110 (63.7)
Headache 748 (10.6) 235 (31.4) 509 (68.0)
Seizure/transient loss of consciousness 538 (7.7) 177 (32.9) 356 (66.2)
Cognitive or behavioral abnormality 344 (4.9) 229 (66.6) 110 (32.0)
Altered level of consciousness 336 (4.8) 209 (62.2) 122 (36.3)
Other focal neurologic deficits
 Motor weakness 1,682 (23.9) 1,299 (77.2) 372 (22.1)
 Dysarthria 693 (9.9) 477 (68.8) 213 (30.7)
 Somatosensory abnormality 280 (4.0) 141 (50.4) 139 (49.6)
 Visual abnormality 217 (3.1) 138 (63.6) 79 (36.4)
 Involuntary movement 123 (1.8) 39 (31.7) 84 (68.3)
 Balance/gait/coordination difficulty 116 (1.7) 62 (53.4) 54 (46.6)
Miscellaneous
 Pain other than headache 44 (0.6) 22 (50.0) 22 (50.0)
 Fever 32 (0.5) 19 (59.4) 13 (40.6)
 Others 129 (1.8) 54 (41.9) 74 (57.4)

Values are presented as number (%).

Table 5.
Primary diagnosis of neurological consultation in emergency room
Patients Number and rate of admission Number and rate of discharge
Diseases of the nervous system 2,254 (32.1) 915 (40.6) 1,327 (58.9)
Episodic and paroxysmal disorders 1,747 (24.9)
Extrapyramidal and movement disorders 130 (1.9)
Nerve, nerve root and plexus disorders 110 (1.6)
Inflammatory diseases of the central nervous system 94 (1.3)
Other disorders of the nervous system 46 (0.7)
Polyneuropathies and other disorders of the peripheral nervous system 39 (0.6)
Demyelinating diseases of the central nervous system 27 (0.4)
Other degenerative diseases of the nervous system 21 (0.3)
Diseases of myoneural junction and muscle 20 (0.3)
Systemic atrophies primarily affecting the central nervous system 18 (0.3)
Cerebral palsy and other paralytic syndromes 2 (0.0)
Diseases of the circulatory system 2,130 (30.3) 1,924 (90.3) 190 (8.9)
Cerebrovascular diseases 2,036 (29.0)
Other forms of heart disease 40 (0.6)
Other and unspecified disorders of the circulatory system 23 (0.3)
Hypertensive diseases 12 (0.2)
Ischemic heart diseases 11 (0.2)
Diseases of veins, lymphatic vessels, and lymph nodes, not elsewhere classified 4 (0.1)
Pulmonary heart disease and diseases of pulmonary circulation 2 (0.0)
Chronic rheumatic heart diseases 1 (0.0)
Diseases of arteries, arterioles, and capillaries 1 (0.0)
Diseases of the ear and mastoid process 993 (14.1) 236 (23.8) 756 (76.1)
Symptoms, signs, and abnormal clinical and laboratory findings, not elsewhere classified 589 (8.4) 111 (18.8) 478 (81.2)
Certain infectious and parasitic diseases 197 (2.8) 121 (61.4) 75 (38.1)
Injury, poisoning and certain other consequences of external causes 145 (2.1) 48 (33.1) 93 (64.1)
Diseases of the eye and adnexa 128 (1.8) 76 (59.4) 52 (40.6)
Mental and behavioral disorders 110 (1.6) 18 (16.4) 92 (83.6)
Diseases of the digestive system 79 (1.1) 59 (74.7) 19 (24.1)
Endocrine, nutritional, and metabolic diseases 78 (1.1) 53 (67.9) 23 (29.5)
Diseases of the respiratory system 74 (1.1) 39 (52.7) 34 (45.9)
Diseases of the genitourinary system 74 (1.1) 51 (68.9) 23 (31.1)
Neoplasms 70 (1.0) 44 (62.9) 24 (34.3)
Diseases of the musculoskeletal system and connective tissue 69 (1.0) 25 (36.2) 44 (63.8)
Factors influencing health status and contact with health services 13 (0.2) 0 (0.0) 13 (100.0)
Diseases of the skin and subcutaneous tissue 10 (0.1) 4 (40.0) 6 (60.0)
Diseases of the blood and blood-forming organs and certain disorders involving the immune mechanism 8 (0.1) 4 (50.0) 4 (50.0)
Congenital malformations, deformations, and chromosomal abnormalities 4 (0.1) 0 (0.0) 4 (100.0)

Values are presented as number (%).

TOOLS
METRICS Graph View
  • 0 Crossref
  •  0 Scopus
  • 1,568 View
  • 106 Download
Related articles


ABOUT
BROWSE ARTICLES
EDITORIAL POLICY
FOR CONTRIBUTORS
Editorial Office
(ZIP 03163) #1111, Daeil Bldg, 12, Insadong-gil, Jongno-gu, Seoul, Korea
Tel: +82-2-737-6530    Fax: +82-2-737-6531    E-mail: jkna@neuro.or.kr                

Copyright © 2024 by Korean Neurological Association.

Developed in M2PI

Close layer